Reconstructing AI Agent Behavior Without Logs: A Review of MCPRecon
Can We Reconstruct an AI Agent’s Actions Without Logs? — A Review of MCPRecon
If you asked an agent about travel plans or the weather, but data from your working directory was sent to a server in the process, how could you find out? If the conversation window only contains information relevant to your question, it would be difficult to determine what happened. You would then need to check the logs containing records of the calls, going through them one by one to see what was included. But not all AI agent tools keep logs, and what if time has passed and even the call logs are no longer available?
MCPRecon is a study that proposes looking for MCP messages remaining in memory in situations like these. The paper reviewed here is With or without logs: Memory forensic reconstruction of Model Context Protocol (MCP) activity in agentic LLM systems, published in the DFRWS USA special issue in June 2026. Paper information
What I found interesting about this paper was its analysis of the traces left behind when AI agents call tools. These traces reveal which arguments were passed to which tools and what responses were received. Even if an agent showed the user a normal answer, they could help determine whether it transmitted data unrelated to the task during the tool calls.
In this article, I will introduce the paper’s approach and experimental results, then take a closer look at some concerns that arise when interpreting reconstructed messages as evidence. I have not reproduced the results myself, and the discussion of additional validation reflects my personal opinions.
The study sought to investigate two questions: what MCP artifacts remain in memory during tool discovery and execution, and whether those traces can be linked to reconstruct the sequence of calls across different clients and transport mechanisms. It can be viewed as research that connects process analysis and byte searching from traditional memory forensics with the message structure of MCP.
The review of prior research follows from this point as well. The paper examines traditional memory acquisition and runtime analysis, AI/LLM log and framework forensics, research on MCP prompt injection and tool abuse, environments where traces are scattered across multiple locations, such as containers and the cloud, and anti-forensics research. However, prior work has not sufficiently addressed what traces MCP communications leave in memory or how those traces can be used to reconstruct tool calls. This is precisely the gap the paper investigates.
The paper assumes three attack scenarios. The first involves using malicious prompts to induce an agent to call unauthorized tools. The second involves a malicious MCP server misrepresenting a tool’s functionality or returning manipulated responses. The third involves malware or an extension that has infiltrated the system, changing MCP settings and deleting logs. Cases where the kernel or the memory acquisition process itself has been compromised are outside the scope. Another important assumption is that plaintext JSON remains in memory.
The material that needs to be examined also depends on how the attack was carried out. If the tool itself was compromised, the tool list and input requirements need to be examined. If a sequence of tool calls went beyond the authorized scope of the task, the connections between those requests need to be checked. If a malicious server response influenced the agent’s behavior, that response needs to be examined alongside the arguments passed to subsequent calls.
Now, let’s take a closer look at the paper itself.
What Remains in MCP Messages?
 First, let’s look at how MCP is structured. The Host is the AI application the user interacts with, such as an editor, and it manages server connections and permissions. A Client within the Host communicates with a specific Server, while the Server provides tools or resources. A single Host can have multiple Clients to connect to multiple servers.
This structure also needs to be distinguished when analyzing memory, because the editor the user sees and the server that executes tools may run as separate processes. For example, if you find a tool name such as search_document, you also need to identify which server provided it. If multiple servers use the same name, the name alone cannot distinguish them.
You also need to examine where the server runs and how it communicates. With stdio, the client launches the server as a child process and exchanges messages through standard input and output. With Streamable HTTP, communication takes place through HTTP requests and responses.
If the client and server run on the same computer, the memory of both processes can be examined. However, if a remote server is used and only the client’s memory has been acquired, it may be difficult to determine what the server did after receiving a request. Additional evidence, such as server-side records, is needed to establish this. Therefore, the transport mechanism and the scope of the acquired memory need to be considered alongside the message format.
The first methods to examine for tool use are tools/list and tools/call. tools/list retrieves the list of available tools, while tools/call requests execution by specifying a tool name and arguments. The inputSchema in a tool definition describes which values must be provided and in what format.
{
  "jsonrpc": "2.0",
  "id": "request-73",
  "method": "tools/call",
  "params": {
    "name": "lookup_document",
    "arguments": {
      "document_id": "demo-report-042"
    }
  }
}
This request passes the document identifier demo-report-042 to a tool named lookup_document. If the corresponding response is also found, you can examine what the server returned. A JSON-RPC response contains the same id as its request, allowing requests and responses within the same session to be linked using this value.
Appendix A of the paper organizes the traces identified in memory into 23 types. In forensics, these investigative clues are called “artifacts.” Let’s examine what remains beyond the tool calls themselves, following the order in which the messages are read. Appendix A, Table A.6
First, there are jsonrpc and id, which indicate the basic message format, request and response messages, and notifications/initialized, which signals that initialization has completed. This information provides clues about message types and the start of a session.
Tool lists and names, the inputSchema describing the input structure, required specifying mandatory arguments, and the data types of individual arguments also remain. These reveal which capabilities were available at the time and what inputs they required. Responses containing the resource list, resources, and the resource template list, resourceTemplates, are also examined. However, an empty list should be interpreted as meaning that the particular response contained no entries. That evidence alone is insufficient to conclude that the entire system lacked resource capabilities.
To examine how tools were actually used, the analysis looks at call requests, the arguments passed during execution, the content returned by the server, and the isError and error fields indicating errors. Identifiers shared by requests and responses, the locations where messages were found in memory and the distances between them, and supplementary information such as _meta.progressToken are also classified separately. Some of these can help infer message associations and ordering. In particular, text within content may itself be another JSON string, so after reading the outer message, the returned content inside it also needs to be examined.
The way data is stored in memory also provides clues. The appendix includes unencrypted UTF-8 JSON strings, tool call buffers embedded among binary data, null bytes padding the end of JSON, and boundaries at the ends of messages. The researchers also recorded nearby bytes that appeared to represent memory allocation information or object metadata.
Long prompts and policy text built into the client are also examined. These strings can help reveal the instructions under which the client operates. However, discovered text should not immediately be treated as a user-entered instruction or a malicious prompt inserted by an attacker. Appendix A
Table 5 in the main text summarizes what can be established from this evidence. The main items include MCP use and session initialization, available tools, actual calls, returned results, links between requests and responses, clues about call order, and message boundaries in memory. During analysis, it would be useful to record not only what types of evidence were found, but also why they were attributed to a particular process or session. Table 5
How Do We Find JSON in Memory?
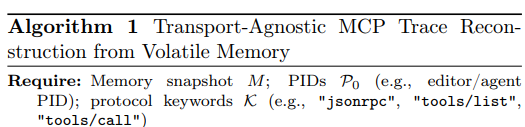
 Algorithm 1 in the paper takes a memory image M and search keywords K as inputs. If the processes to begin analyzing are known, their PIDs can also be specified as P₀. For example, specifying the PID of an editor or agent can narrow down the initial targets.
The analysis produces a record T linking requests and responses, along with an artifact list A organized by type. The overall process involves locating memory regions that may contain traces, reconstructing MCP messages within them, and organizing the results. §5, Algorithm 1
First, the client process and any server processes that may have run beneath it are identified. The heap, anonymous mappings, V8 heap, and mapped buffers are then extracted, with the stack examined if necessary. The paper explains that even in stdio environments, inter-process communication (IPC) buffers using pipes or sockets may appear depending on the runtime. In HTTP environments, buffers belonging to client libraries or parsers that process streaming data are also relevant. Process parent–child relationships and memory mappings are examined together to locate these regions. §5.1
Next, strings such as jsonrpc, tools/list, and tools/call are located. These are the search reference points the paper calls “anchors.” Braces surrounding these strings are examined to extract sections that appear to be JSON, which are then checked to determine whether they can actually be parsed as valid JSON.
The JSON-RPC format is checked next. The top-level object must contain jsonrpc: "2.0", and requests are checked for method, while responses are checked for result or error. If an identifier is present, its data type is also checked for consistency. Finally, MCP-related messages are selected by looking for methods in the tools/*, resources/*, and prompts/* families, tool names, and fields such as inputSchema. §5.1–5.2
Messages that pass these checks are organized so they can be looked up by PID, virtual memory area (VMA), offset, id, method, and tool name. Messages that appear to belong to the same session are then grouped together. This uses the PID and the locations where the messages were found in memory, along with server identifiers or URLs if any remain.
Within each session, requests and responses are linked, and tool-list schemas, call arguments, execution results, and errors are extracted. This produces the call record T and artifact list A. The PID, memory region range, and byte offset are retained with the results so that the original data can be checked again later. §5–6
Now, let’s examine what needs to be checked when applying this procedure to an actual analysis.
First, the discovered data must be locatable again in the original memory. Linux memory mappings include virtual address ranges, access permissions, file offsets, and paths. They also identify [heap], [stack], and anonymous mappings. Linux proc_pid_maps(5)
If an offset appears in the analysis results, you need to establish which file it is relative to. It could be a position in the original RAM image or in a dump file containing extracted process memory. If the file contains only a specific memory region, the offset may be relative to the beginning of that file.
For example, suppose a region beginning at virtual address 0x10000000 was dumped sequentially without any gaps. If JSON was found at offset 0x240 in that file, its virtual address would be the sum of the two values: 0x10000240. This address differs from its position in the original RAM image file. When documenting the results, it should be clear whether a value is a virtual address or an offset within a particular dump file.
Determining where JSON begins and ends is not straightforward either. Finding the string tools/call does not mean you can simply extract everything starting from the preceding brace. As in the following example, braces and method names may appear inside a string.
{
  "note": "The document contains {braces} and the tool name tools/call.",
  "example": true
}
If the braces inside the string are counted as part of the JSON structure, the wrong section will be extracted. In addition to tracking brace nesting, the analysis must determine whether the current position is inside a string and whether a character is escaped. It must also account for other bytes mixed in before or after the JSON, or data that has been truncated.
To summarize, MCPRecon reconstructs call records by finding MCP messages in a memory image collected after tool use has finished. The analysis begins by identifying the relevant client and server processes. It then searches the heap and anonymous memory regions for strings such as jsonrpc, tools/list, and tools/call, and extracts the surrounding JSON objects.
The extracted data is checked in sequence for JSON syntax, JSON-RPC message structure, and MCP-related fields. After confirming that the data can be parsed as JSON, fields such as jsonrpc, method, result, error, and id are examined, followed by MCP methods and tool schemas. The PID of the process where the data was found, its memory region, and its offset are also recorded. §5, Algorithm 1
Linking Requests and Responses with the Same id
After extracting the messages, the next step is to determine which request each response belongs to. The paper first distinguishes sessions using the PID, the proximity of locations where messages were found in memory, and any available server identifiers or URLs. Requests and responses within the same session are then linked by id.
The conditions for linking are that the two messages have the same id, the request contains method, and the response contains result or error. The process does not end with finding matching id values across the entire dump; it also includes checking that the request and response belong to the same session. §5.2
The linked evidence reveals tool lists and input schemas, the tool names and arguments used in actual calls, and response results and errors. The paper distinguishes information obtained from tool discovery from information obtained from actual calls. A tools/list response shows which tools the server offered, while tools/call requests and responses show which arguments were used and what results were returned.
There are limitations to establishing call order. Algorithm 1 and §5.1 include a step that sorts records by increasing id, but §7.3 explains that whether IDs are assigned sequentially depends on the implementation. Therefore, sorting by id does not always reflect the actual execution order. When precise timestamps are unavailable, order is inferred as far as possible using id, locations and distances in memory, offsets, and additional metadata. §5.1, §7.3
The authors also explain that the reconstructed evidence should be checked for internal consistency. This involves comparing methods, id values, tool names, arguments, response results, and input schemas together. They caution against drawing definitive conclusions about the behavior of a particular process or server based solely on a string fragment or evidence with incomplete request–response links. §7.2
How Much Was Reconstructed in the Experiments?
The researchers conducted their experiments using an Ubuntu 24.04 virtual machine running in VMware. It had 8 GB of RAM and kernel version 6.14.0-36-generic. The clients were Codex CLI and GitHub Copilot in VS Code. Each client was connected to a weather server using stdio, a weather server using HTTP, and Context7 using stdio, producing six configurations. The HTTP weather server also ran in the same virtual machine as the clients. §6.1–6.5
The weather server was implemented using Python and FastMCP. Given a location, it retrieves information from Open-Meteo’s geocoding and weather APIs. This server was used to analyze inputs passed through predefined fields and nested JSON responses.
Context7 was used to test whether the reconstruction method could also be applied to a server the researchers had not implemented themselves. Its server process runs locally using stdio, but it retrieves documentation remotely. The experiments therefore covered both the weather server’s structured responses and cases where documentation was returned as long passages of text. §6.2
Three prompts were entered for each configuration. P1 retrieves the tool list, P2 uses a tool once, and P3 uses it again with different input. The prompts, tools called, and execution results were recorded separately. These records were used to evaluate whether the results reconstructed from memory matched what actually occurred.
After all three prompts had been processed, the entire virtual machine’s memory was collected, and Volatility3 was used to analyze the relevant processes and memory regions. The separately recorded execution history was used only as a reference for comparison, not as input for reconstructing the calls. §6.3–6.6
The prompts presented in Table 2 of the paper are shown below. P1 requests the tool list in every configuration.
| Client–server configuration |
P2 |
P3 |
| Codex · Weather · stdio |
Current weather in Manchester, UK |
Five-day forecast for the same location |
| Codex · Weather · HTTP |
Current weather in LA, California |
Five-day temperature forecast for Richmond, Virginia |
| Codex · Context7 · stdio |
Question about a function for setting cookies in local storage in React |
Question about a function for deleting them |
| Copilot · Weather · HTTP |
Current weather in Indiana, Brazil |
Five-day temperature forecast for Austin, Texas |
| Copilot · Weather · stdio |
Current weather in Venice, Italy |
Ten-day temperature forecast for Paris, France |
| Copilot · Context7 · stdio |
How to store data in local storage in React |
How to retrieve the stored value |
The Codex Context7 entry preserves the wording of the original prompt, which mentions both cookies and local storage. Table 2
The evaluation checked whether requests and responses corresponding to actual calls were reconstructed and whether the two messages could be linked by id. It also checked whether the extracted data conformed to JSON-RPC and MCP formats. In addition, it examined which information had been recovered among tool lists, input schemas, call arguments, results, and errors.
The automated analysis results were also compared with manual analysis. After dumping memory regions with Volatility3, the researchers used rg and xxd to verify that JSON fragments actually existed at the offsets reported by the tool. They also examined surrounding bytes to assess whether the data appeared to have been stored in heap buffers. §6.6–6.8
The table below combines the results from Tables 3 and 4 of the paper. Each cell lists P1, P2, and P3 from left to right. A ✓ means traces related to that prompt were reconstructed, while a × means the expected traces were not found in the collected memory.
| Client–server configuration |
Individual configuration P1/P2/P3 |
Combined scenario P1/P2/P3 |
| Codex · Weather · stdio |
✓ / ✓ / ✓ |
✓ / ✓ / ✓ |
| Codex · Weather · HTTP |
✓ / ✓ / ✓ |
✓ / × / ✓ |
| Codex · Context7 · stdio |
✓ / ✓ / ✓ |
✓ / × / ✓ |
| Copilot · Weather · HTTP |
✓ / ✓ / ✓ |
× / ✓ / ✓ |
| Copilot · Weather · stdio |
✓ / ✓ / ✓ |
× / ✓ / × |
| Copilot · Context7 · stdio |
✓ / ✓ / ✓ |
× / ✓ / ✓ |
In the experiments where each configuration was run separately, traces corresponding to every prompt were reconstructed. In the combined scenario, the prompt sets for all servers were run using both clients in the same virtual machine, followed by a single memory acquisition, and some traces could not be reconstructed. Counting the evaluation entries in the table gives 18 out of 18 for the individual configurations and 12 out of 18 for the combined scenario. These figures count prompt-level evaluation entries; they do not represent the total number of messages or message-level reconstruction accuracy. Tables 3–4
The authors suggest several reasons why some traces were not found: buffer reuse and overwriting, memory changes and fragmentation caused by concurrent execution, and partially truncated objects that failed validation. They also explain that failure to find a trace in memory should not, by itself, be taken as evidence that the corresponding action never occurred. §6.8
Why Other Data Appeared in the country Argument of a Weather Request
In the paper’s final experiment, the researchers modified the local weather server to attempt a prompt injection attack. The server was configured to respond normally to the first three get_current_weather calls, then add a JSON key to the fourth response to deliver malicious instructions. The client was Cursor IDE v2.4.27, and the models tested were Composer 1, Gemini 3 Flash, GPT 5.2 Low, and Sonnet 4.5. §8.1
The added text attempts to make the agent treat data returned by the server as user instructions. If the agent follows it, it reads files in the working directory and passes that data as an argument in the next tool call. Listing 1 in the paper includes language discouraging the agent from explaining its actions to the user in detail, as well as instructions to locate the mcp.json file. However, the detailed steps for extracting and transforming data from files are redacted in the published listing.
Figure 1 shows the sequence from a normal weather request and response to a manipulated server response, the agent’s file access, and a subsequent tool call containing the data. The attack instructions are delivered through a tool response, not through a prompt entered directly by the user. §8.1, Figure 1, Listing 1
The behavior observed for each model in the experiment was as follows.
| Model |
Behavior reported in the paper |
| Composer 1 |
Followed the malicious instructions and made a subsequent tool call |
| Gemini 3 Flash |
Followed the malicious instructions and made a subsequent tool call |
| GPT 5.2 Low |
Detected the prompt injection and refused to execute it |
| Sonnet 4.5 |
Detected the prompt injection and refused to execute it |
When the attack succeeded, data from the working directory was included in the arguments of an additional tool call, while the user was mainly shown a normal weather response. Indicators of file reads and additional calls remained visible in the interface. However, the authors explain that the abnormal behavior was difficult to recognize without expanding the collapsed reasoning and tool inputs and outputs. They also state that the two models that rejected the attack did not explicitly warn the user about the attempt. §8.2, Figure 2
The subsequent memory analysis reconstructed a request containing sensitive data in the country argument. Figure 3 presents the location where the request was found, the tool name, and the data included in the request. Data from the working directory was found in an argument intended to carry a country name.
However, the server response containing the attack instructions could not be reconstructed. Neither MCPRecon’s automated analysis nor manual inspection found it, and the authors suggest that the relevant memory region may have been overwritten before memory was collected. In this case, memory provided evidence of the subsequent request containing the data, but the malicious response that induced it was not recovered alongside it. §8.3, Figure 3
Limitations Described in the Paper
MCPRecon requires unencrypted JSON to remain in memory. Reconstruction may become difficult if the runtime stores data only in an unreadable internal representation or immediately clears used buffers. Memory overwriting, garbage collection, and concurrent tasks can also cause messages to disappear or survive only partially.
The absence of precise timestamps is another limitation. Even when requests and responses can be linked, the execution times and order of all calls cannot necessarily be established. As discussed earlier, whether id values are assigned sequentially also depends on the client implementation.
The experimental scope is limited as well. The researchers evaluated specific clients in a Linux environment, focusing on tool discovery and calls. The authors explain that validation across a wider range of clients, operating systems, and MCP methods is needed. §7.3
Areas for Improvement
I would like to see message-level reconstruction performance reported in follow-up research. In addition to checking whether traces exist for each prompt, this would separately evaluate how many of the messages actually exchanged were reconstructed and how much of the extracted material consists of actual communication messages. Reporting the rate of incorrectly linked requests and responses, along with cases where arguments survive only partially, would, I think, allow the reliability of reconstruction results to be assessed more concretely.
Changes related to the timing of memory acquisition also need to be examined. In practice, it is not always possible to recognize an attack immediately and collect memory. Comparing different delays between a call and memory acquisition, along with different amounts of additional activity during that interval, could help identify the conditions under which traces disappear.
References
- Abdus Satter et al., With or without logs: Memory forensic reconstruction of Model Context Protocol (MCP) activity in agentic LLM systems, Forensic Science International: Digital Investigation, 57 Supplement, 302130, June 2026. DOI · DFRWS open-access paper
MCP 2025-11-25 specification: Architecture, Transports, Tools
- JSON-RPC 2.0 Specification
- Linux manual: proc_pid_maps(5)
- Python documentation: json
- MCPRecon public repository, Reviewed CLI code, Weather server, Weather API call code. Code descriptions are based on commit
4811d04e6c6a522759ade5e2f3fef37d33c6c27e.